
Use this free ROAS calculator to work out your return on ad spend, the break-even ROAS your margins require, and the real return on your marketing investment. Results update as you type. Below the calculator you will find the formulas, worked examples, and a second tool that checks whether your most recent spend is still paying back.
ROAS and marketing ROI calculator
Enter monthly figures for a campaign, channel or your whole program.
What is ROAS?
ROAS, or return on ad spend, measures how much revenue you earn for every dollar spent on advertising. A ROAS of 4x (also written 4:1 or 400%) means each dollar of ad spend brought in four dollars of revenue.
It is the most widely used efficiency metric in paid media because it is simple and every ad platform reports it. Its limits are just as important: ROAS ignores every cost except media, and on its own it says nothing about profit.
How to calculate ROAS
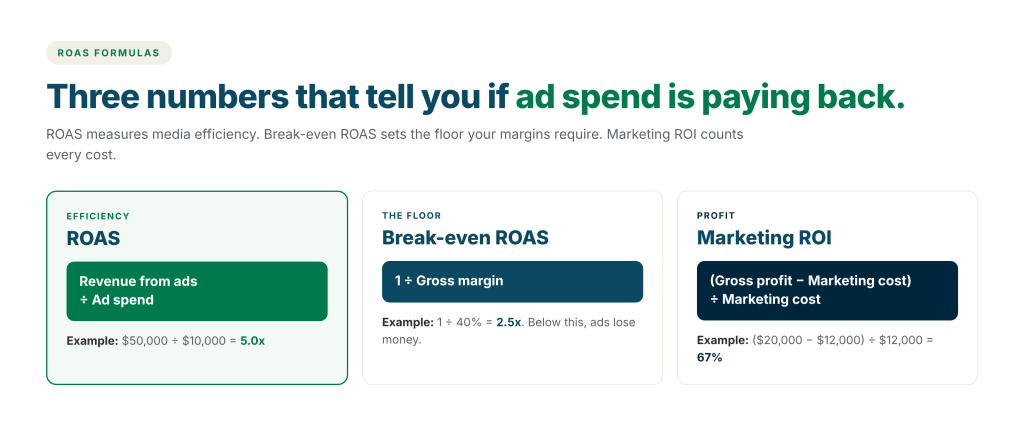
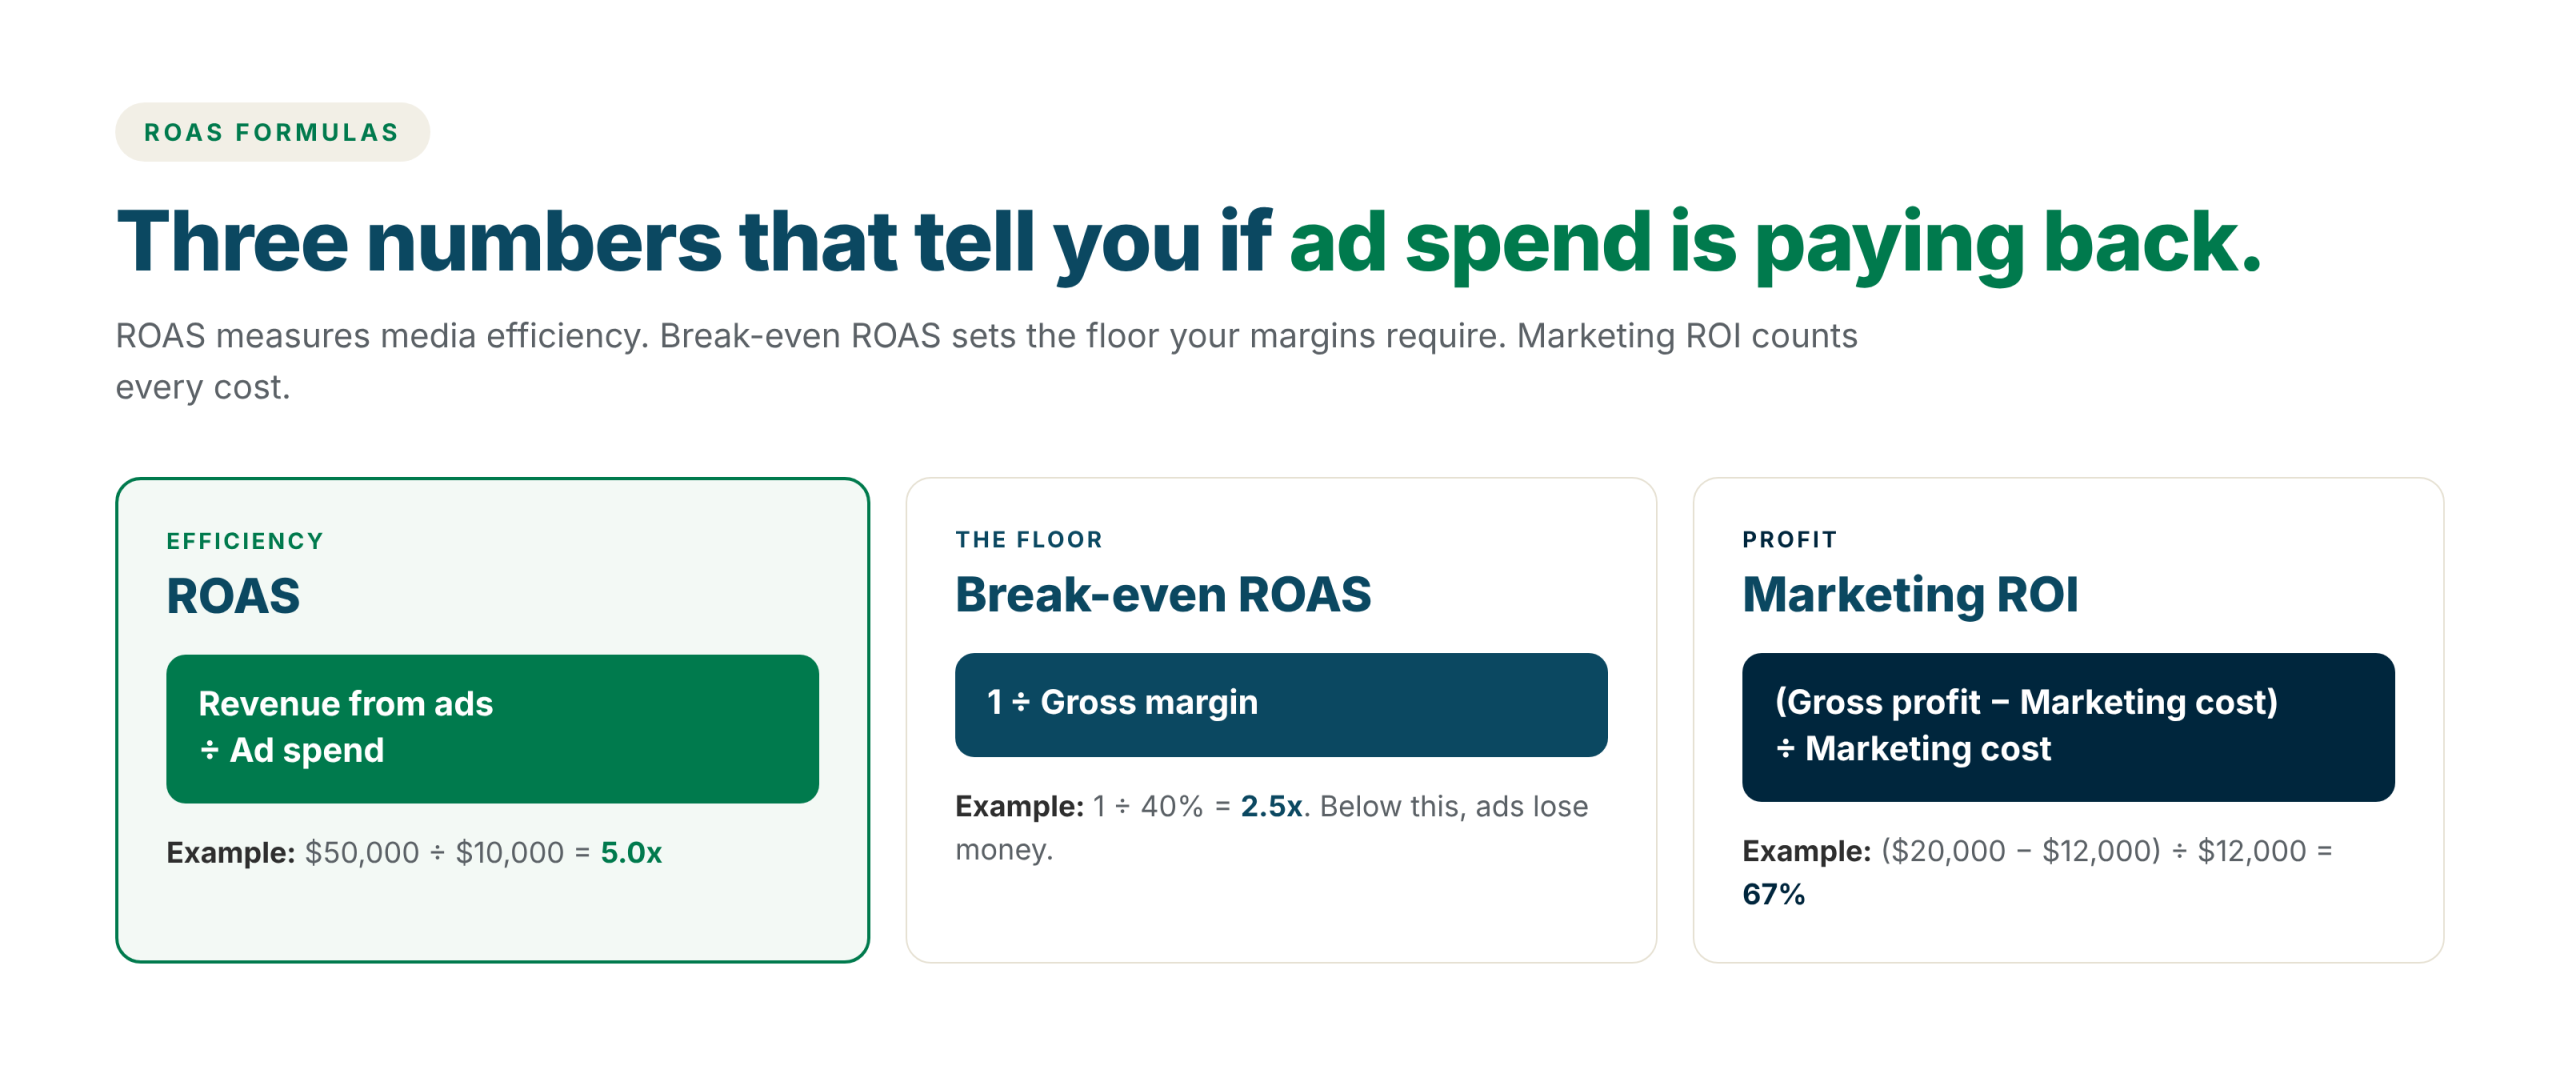
ROAS = revenue from ads ÷ ad spend
Say you spend $10,000 on paid social in a month and those campaigns drive $50,000 in revenue. Your ROAS is $50,000 ÷ $10,000 = 5.0x.
The arithmetic is easy. Two choices change the answer far more than the math does: which revenue you count, and over what period. Each ad platform reports conversions using its own attribution rules, so the totals across Meta, Google and TikTok usually add up to more sales than you actually made. For budget decisions, use revenue you can reconcile to your own sales data, measured over a window long enough to capture delayed purchases.
Break-even ROAS: the number that matters most
A 3x ROAS can be excellent for one brand and a loss for another. The difference is margin. Break-even ROAS is the point where the gross profit from ad-driven sales exactly covers the ad spend. Below it, every sale costs more to win than it earns.
Break-even ROAS = 1 ÷ gross margin
With a 40% gross margin, break-even ROAS is 1 ÷ 0.40 = 2.5x. Here is how break-even moves with margin:
| Gross margin | Break-even ROAS |
|---|---|
| 20% | 5.00x |
| 30% | 3.33x |
| 40% | 2.50x |
| 50% | 2.00x |
| 60% | 1.67x |
| 70% | 1.43x |
Break-even is the floor, not the goal. To build a profit target into the number, subtract your target profit margin first:
Target ROAS = 1 ÷ (gross margin − target profit margin)
With a 40% gross margin and a 15% profit target, target ROAS is 1 ÷ 0.25 = 4.0x.
ROAS vs. ROI: what is the difference?
ROAS measures how efficiently media spend turns into revenue. Marketing ROI measures whether marketing made money once all costs are counted, including agency fees, tools and creative production.
Marketing ROI = (gross profit − total marketing cost) ÷ total marketing cost
Using the earlier example: $50,000 in revenue at a 40% margin produces $20,000 in gross profit. If you spent $10,000 on media and another $2,000 on creative and tools, ROI is ($20,000 − $12,000) ÷ $12,000 = 67%.
Use ROAS to compare campaigns and channels week to week. Use ROI to judge whether marketing as a whole is earning its budget.
What is a good ROAS?
There is no universal benchmark worth using, because a good ROAS depends on your margin, how often customers buy again, and what the campaign is for. Instead of comparing against an industry average, check three things:
- Is it above break-even? If not, the campaign loses money on each first order.
- Does lifetime value change the picture? If customers reorder, a first-order ROAS below break-even can still be profitable. Judge new-customer campaigns on lifetime value, not on the first order alone.
- Is it incremental? Branded search and retargeting often show the highest ROAS because they capture demand that already existed. A high number does not prove the ads caused the sale.
Why average ROAS can mislead: check your marginal ROAS
Average ROAS divides total revenue by total spend. Marginal ROAS looks only at the most recent increment: the extra revenue from the extra spend. As a channel scales, returns diminish, so the average can look healthy long after the last dollars stopped paying back.
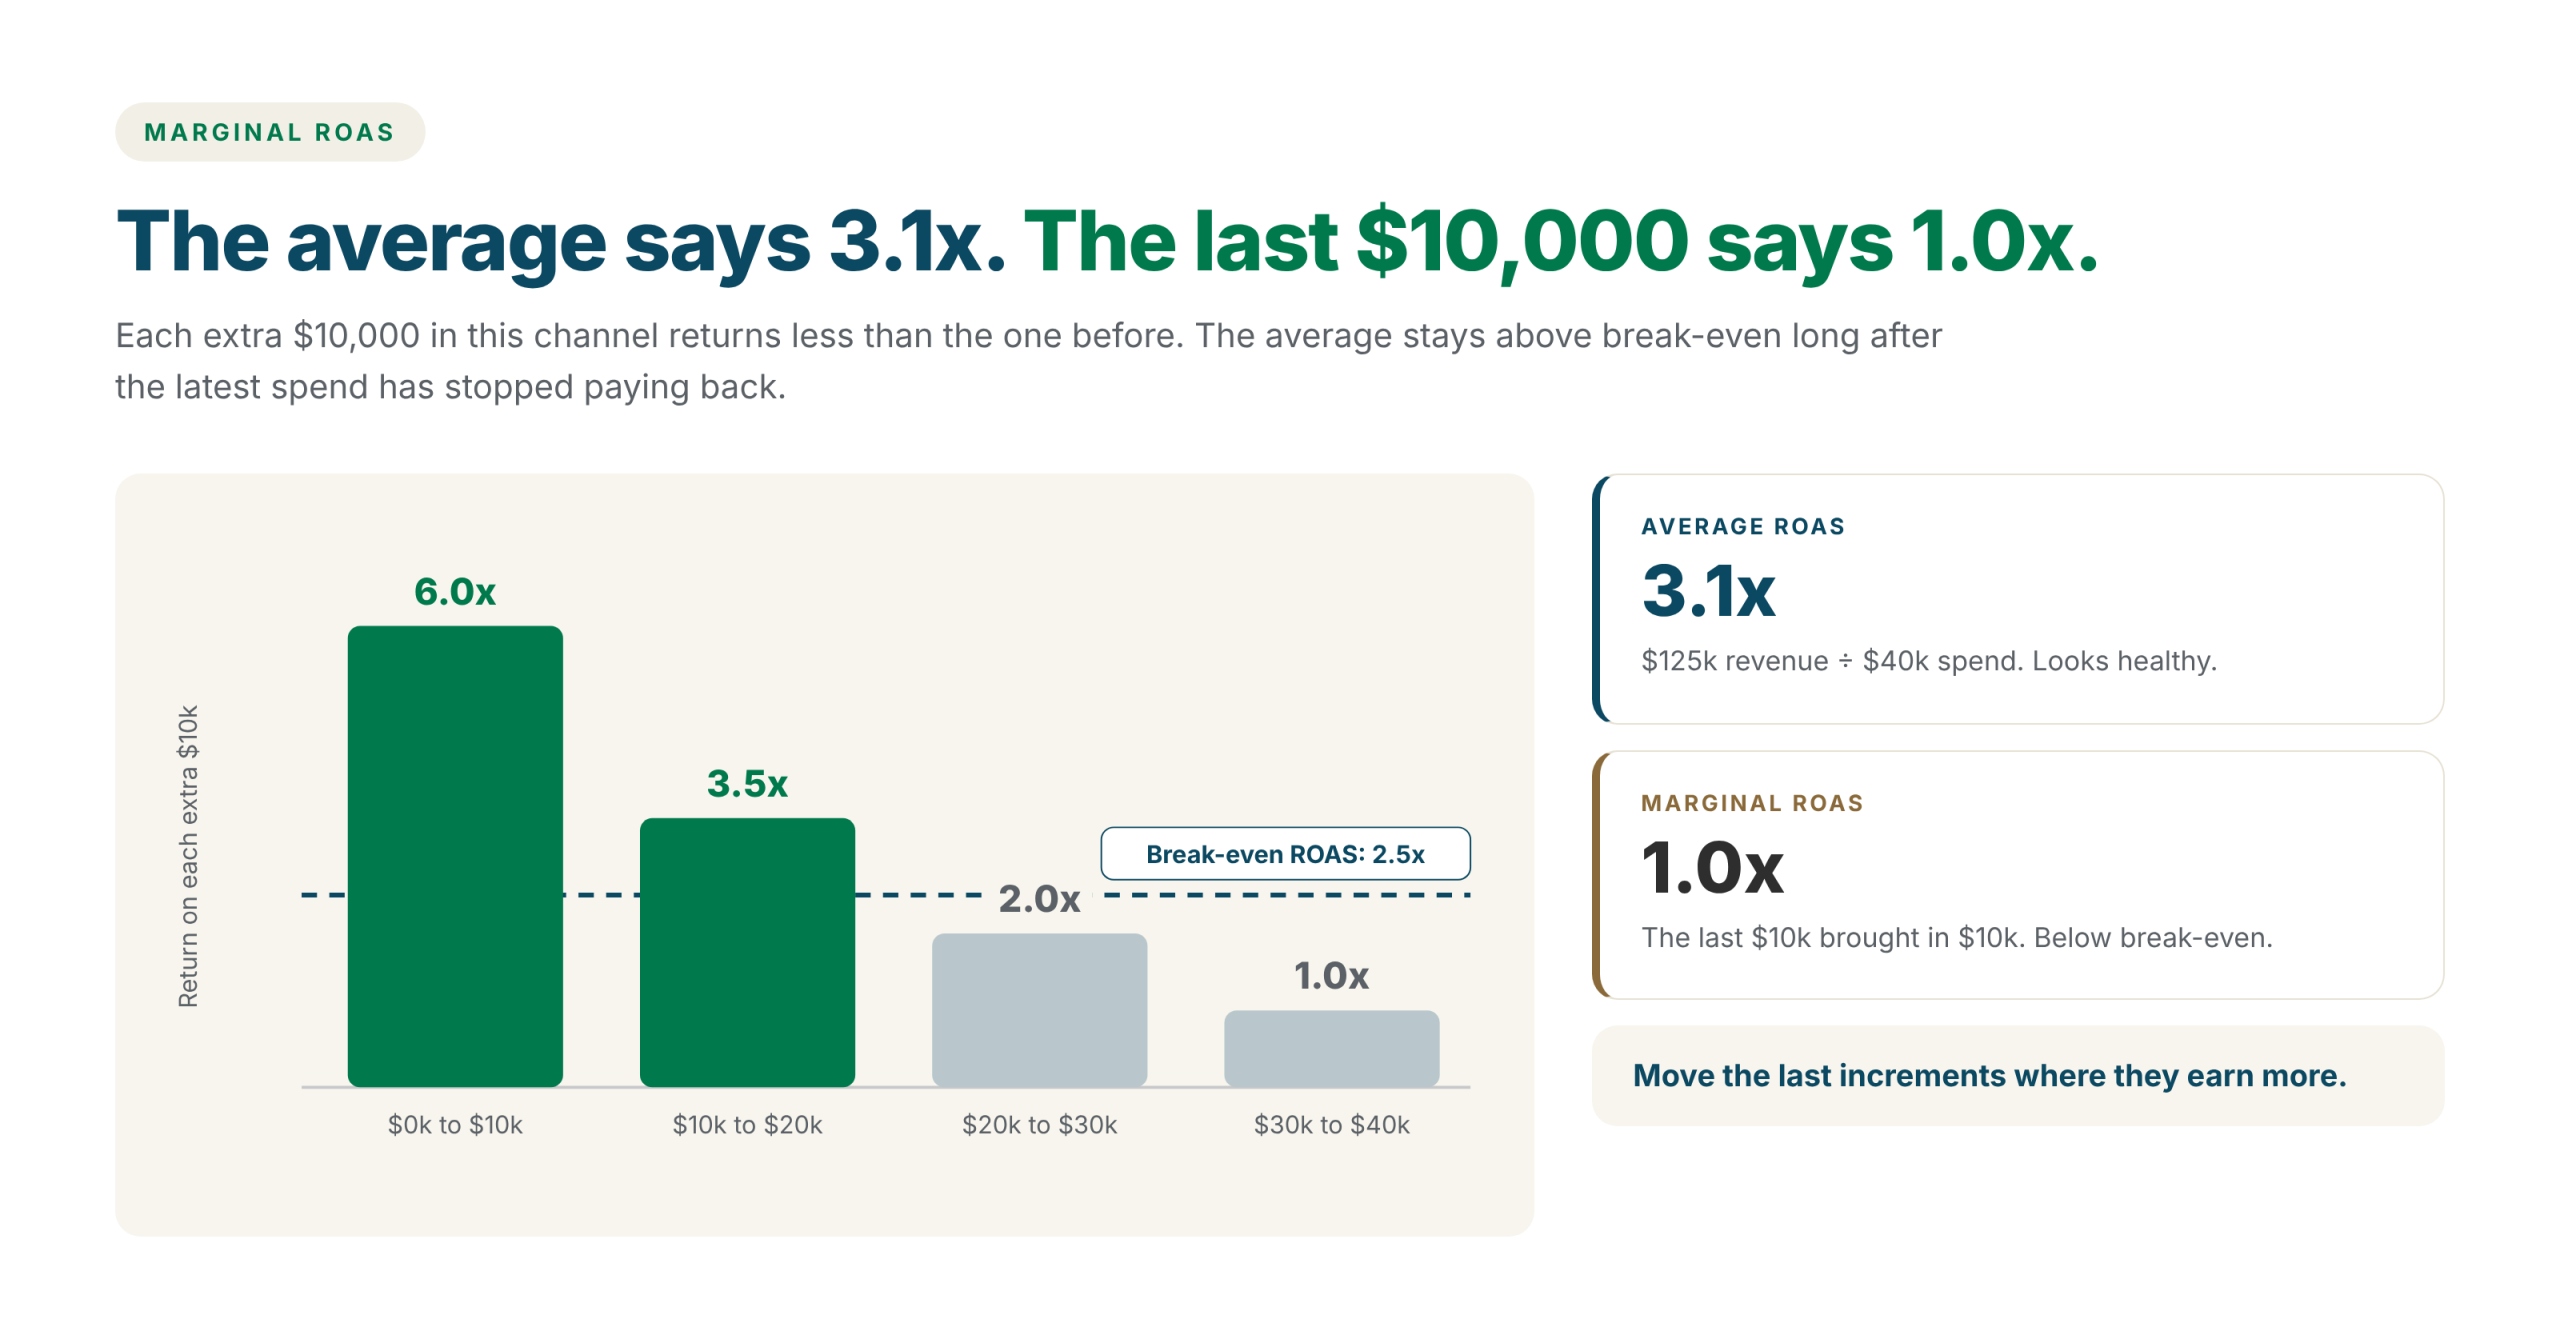
In this example the channel’s average ROAS is 3.1x, comfortably above a 2.5x break-even. But the last $10,000 returned only 1.0x, and the $10,000 before it returned 2.0x. Both increments sit below break-even. Cutting that increment, or moving it to a channel with more room to grow, would raise profit while the dashboard average barely moves.
Use the calculator below to compare two spend levels from your own data, such as last month and this month, or two test periods.
Marginal ROAS calculator
Compare two spend levels to see what the extra spend actually returned. Uses the gross margin from the calculator above.
Treat this comparison as directional. Seasonality, promotions and creative also change between periods. For a reliable read, marketing mix modeling estimates each channel’s response curve while controlling for those factors, and our guide to marketing budget allocation shows how to split a budget using marginal returns.
How to improve ROAS
- Cap saturated campaigns. Where marginal ROAS has fallen below break-even, pull the last increment of spend first.
- Move budget to channels with room to grow. The steep part of a response curve earns more than the flat part of another.
- Fix the landing page before the ad. Conversion rate moves ROAS as much as cost per click does.
- Raise average order value with bundles, thresholds and relevant add-ons.
- Refresh creative before it fatigues. Falling click-through rates usually show up in ROAS a few weeks later.
- Measure on reconciled revenue, not the sum of what each platform claims.
How Insika helps you find the next best dollar
Insika connects ad platforms, Shopify, analytics, CRM and retail sales data, estimates how each channel responds to spend, and shows where the next dollar will earn the most. Instead of another ROAS report, your team gets recommended budget moves with the evidence behind them, and approves what goes live. GURU Organic Energy used this approach to cut planning cycles by 90% and lift sales by 23%.
Frequently asked questions
Is ROAS the same as ROI?
No. ROAS compares revenue with ad spend only. ROI compares profit with all marketing costs. A campaign can have a strong ROAS and a negative ROI if margins are thin or other costs are high.
How do you express ROAS as a percentage?
Multiply the ratio by 100. A ROAS of 5x is the same as 500%, and 2.5x is 250%.
What is break-even ROAS?
It is the ROAS at which gross profit from ad-driven sales exactly covers ad spend. Calculate it as 1 divided by your gross margin. A 50% margin means a break-even ROAS of 2.0x.
Should revenue in ROAS include shipping and taxes?
Use revenue net of taxes, shipping charges, discounts and returns, so the figure reflects what you actually keep. Whatever definition you choose, apply it consistently across channels.
Why does my ROAS differ between Meta and Google Analytics?
Each tool uses its own attribution model and window, and ad platforms can count view-through conversions that analytics tools do not. Neither is wrong, but neither tells you what the ads actually caused. That is the gap incrementality testing and marketing mix modeling are designed to close.
Want to see where your next dollar should go across every channel? Watch the Insika demo or talk to our team.